Persona by Whitehot
Market research just got personal
Persona goes beyond market research. It is market personality. Realistic customer responses for your target markets, enhanced with predictive insights traditional research cannot reach. Competitive positioning, segment objections, and purchase triggers surfaced automatically. Every output is structured for strategic planning, marketing, sales, and customer support. Ready for AI knowledge banks, fine-tuning, RAG, and content personalisation. The depth of traditional research. A fraction of the cost and time. And insights that actually surprise you.
Request a Pilot of PersonaHow It Works


Market research is being fundamentally reshaped. Peer-reviewed research from Harvard Business School has demonstrated that large language models can replicate human consumer behaviour with enough fidelity to inform real product and pricing decisions, not as a novelty, but as a viable methodology.1 Separately, Stanford researchers validated AI-generated responses across 476 experiments, finding strong correlation with actual human results.2
For mid-tier businesses, this shift is particularly significant. Synthetic respondent panels compress weeks of recruitment and fieldwork into hours. Brand positioning can be stress-tested against simulated consumer segments before committing real budget. Creative concepts can be evaluated by AI panels before they reach production. Competitive intelligence can be gathered and synthesised continuously, without the constraints of traditional research timelines.
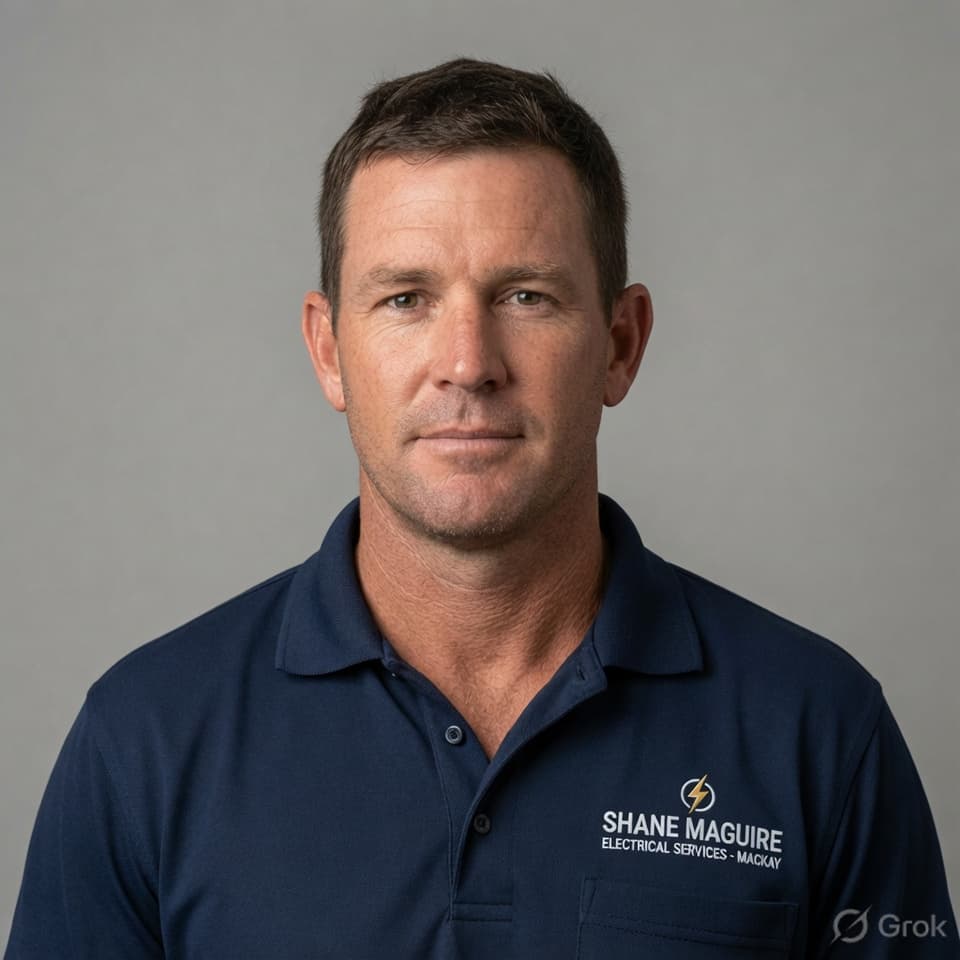
Priya SharmaFleet & Equipment Manager · 65 vehicles · Sydney“What does this cost across 12 trucks over 5 years?”
Fleet and Equipment Manager at Greystone Civil Pty Ltd (~180 employees, 65 vehicles, ~$55M turnover). Manages 28 utes, 12 medium rigid trucks, tippers, crane trucks, and trailers. Reports to Operations Director, works closely with WHS Manager and CFO. Annual fleet storage budget ~$25–35K.
BBus (Logistics) + Dip WHS | Combined household ~$340K
Currently uses Boss Aluminium (utes) and LDR Industries (trucks). Replacing 3–4 steel boxes per year at $800–$1,200 each due to corrosion. Two Hinos flagged in a CoR audit for GVM compliance. Inconsistent fitout across fleet.
Marginal AerozBox awareness, has seen the Aeroz name on a Fuelscoop fitted to a Hino. Would be receptive if approached with weight savings and corrosion data.
Under $5K: approves directly. $5–20K: needs Ops Director sign-off with one-page business case. $20K+: needs CFO approval via formal capex request (2–4 weeks). Has had three capex requests rejected in two years.
- TCO over 5–7 years
- Weight savings (GVM compliance)
- Corrosion resistance
- WHS documentation
- Standardisation
- Supplier reliability
- Environmental credentials
- Corrosion, replacing 3–4 steel boxes per year at $800–$1,200 each
- GVM compliance, two Hinos flagged in CoR audit
- Inconsistent fitout across fleet
- Three capex requests rejected in two years
Methodical, data-driven, politically savvy. Keeps a spreadsheet of every accessory failure with costs. Risk-averse with unknown brands. Member of Australasian Fleet Managers Association. 650+ LinkedIn connections.
Professional, structured, slightly formal. Uses GVM, CoR, TCO, capex precisely. Full sentences with reasoning. Comfortable with spec sheets. Diplomatic even when negative.
Uses Likert scales deliberately, a 5 means she has data to support it. Open-ended responses 3–6 sentences with structured reasoning. Thinks in fleet terms. Evaluates against Boss and LDR as benchmark.
How Priya decides (Reasoning Diversity, Hong-Page Theorem): Spreadsheets and business cases. Every decision is TCO over 5–7 years. Will not raise it with her Ops Director without a one-page case with numbers.
Her biggest fear (Pre-Mortem, Klein): "The poly degraded under UV after 18 months, now I have got 12 trucks fitted with a product I need to replace, and Amanda is asking why I championed an unknown brand." Career risk is the dominant failure mode.
What she will push back on (Adversarial Challenge): Single-supplier risk, unknown brand in a conservative industry, UV and chemical resistance under real fleet conditions, whether TCO claims hold across mixed vehicle types.
Where the group can shift her (Delphi Convergence): Fleet-scale evidence from Doug or Brent would move her. Would converge fast on feature priorities (GVM, corrosion, standardisation) because her framework is internally consistent.
Who else matters (Stakeholder Perspective): Her CFO (capex vs opex and payback), her Ops Director (CoR compliance), her WHS Manager (documented safety specs), her drivers ("does it lock and can I get in quick?").
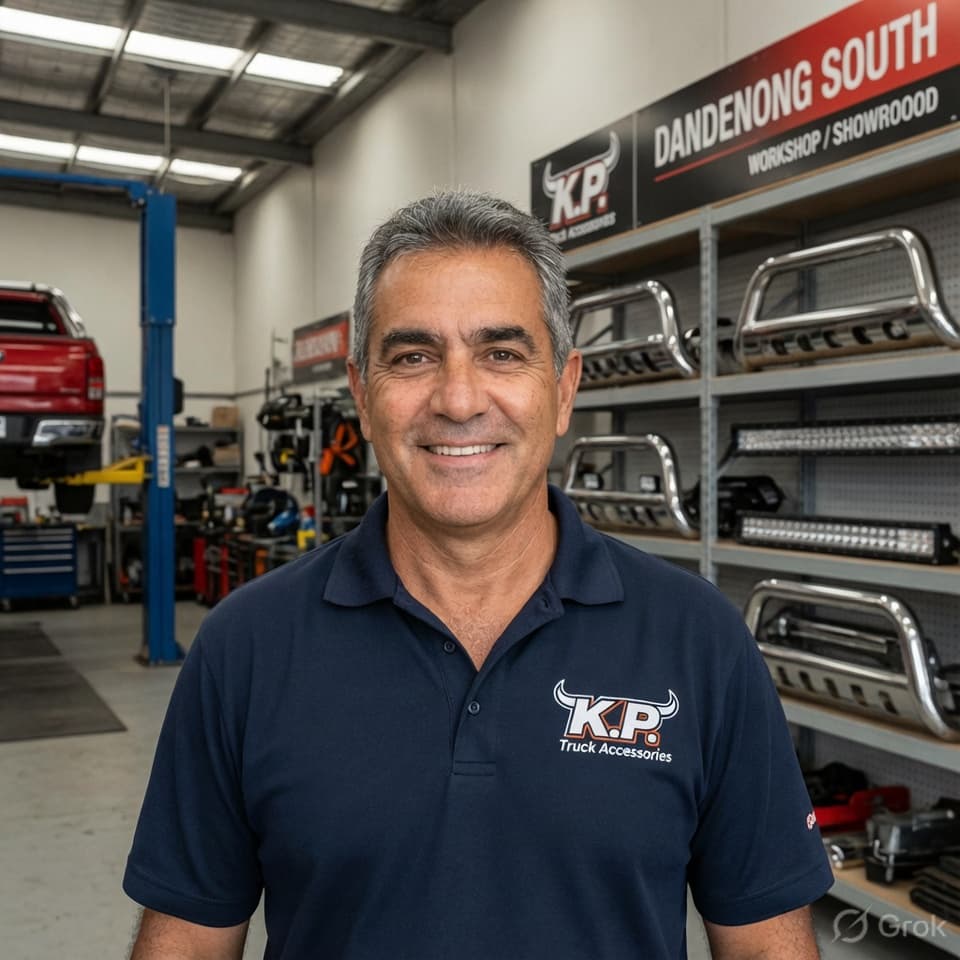
Kev PappasIndependent Truck Accessories Dealer · Dandenong South, VIC“Interesting, but my customers are going to ask me why it is plastic.”
Owner of K.P. Truck Accessories, single-location shop in Dandenong South since 2004. 280sqm retail/showroom + 180sqm workshop. 5 staff. Sells Fuelscoops, existing Aeroz relationship (4 years). Annual toolbox sales ~$280–340K (~400–500 units).
Year 11 + Cert III Automotive Body Repair | Business ~$1.8M turnover
Boss ~38% margin, OZY ~42%, imported budget ~55–60% (quality problems). Has been trying to find a mid-priced alternative with better quality than imports but better margin than Boss. Has never been offered AerozBox.
Does not know AerozBox exists. If shown the range: "Interesting, but my customers are going to ask me why it is plastic." The AquaBox80 would be the product that gets him to take a meeting.
"What is my margin?" (needs 35%+, ideally 40%+). "Will my customers buy it?" (needs demo unit). "What is the warranty?" "Is the Aeroz rep going to support me?" "Do I get territory protection?"
- Margin (35%+ minimum, 40%+ ideal)
- Customer demand and sellability
- Warranty reliability
- Territory protection
- Supplier support and rep quality
- Product differentiation
- Online sellers undercutting retail ($80 cheaper on eBay)
- Fabrication economics shifting
- $65K in toolbox inventory as dead capital
- No differentiation from other aluminium shops
Classic small business owner, works hard, worries about cash flow, takes enormous pride in what he has built. Relationship-driven. Sponsors local under-15s football. Orders by phone or email, not online portals.
Warm, direct, talks fast. "Mate" within 30 seconds. Tells shop floor stories. Self-deprecating about technology. Describes good products as "quality gear" and bad ones as "rubbish."
Polarised on Likert scales, strong 4s and 5s for likes, 1s and 2s for dislikes. A 3 means genuinely undecided. References Boss or OZY as benchmarks unprompted. Calculates margin instantly in his head.
How Kev decides (Reasoning Diversity, Hong-Page Theorem): Margin first, relationships second. "What is my margin?" then "Will my customers buy it?" Floor-space economics and inventory turn rate. Loyalty to good reps, cold fury at betrayal.
His biggest fear (Pre-Mortem, Klein): "I stocked 50 units, they sat on the shelf for 6 months because customers could not get past 'plastic,' and now I have got $15K in dead capital."
What he will push back on (Adversarial Challenge): Territory protection, online channel conflict, margin compression if competitors stock AerozBox too, warranty support track record, and whether Aeroz can fulfil orders on time.
Where the group can shift him (Delphi Convergence): Will not budge on brand trust without a demo unit in-store. Margin requirements are fixed (35%+). But enthusiasm from Tanya or Brent would move him, he respects channel peers over end-users.
Who else matters (Stakeholder Perspective): His tradies ("plastic" is a hard sell at the counter), Nick his son (wants something photogenic for social), his accountant (inventory turns), Boss Aluminium (competitive threat).
Pre-mortem analysis surfaces the objections your sales team will face before they hear them. Adversarial challenge finds the weak points in your positioning before your competitors do. Delphi convergence shows you where the market agrees, and, more usefully, where it does not. These are the unexpected insights that inform your strategic thinking and creative development, not synthetic survey responses trained to mirror the average.
Every output is a working dataset, not a static report. Segment objections, purchase triggers, stakeholder tensions, all structured and ready for development of marketing messages, sales scripts, and campaign targeting. Useful to artificial intelligence and intelligent humans.
- 1.Brand, J., Israeli, A. & Ngwe, D. (2023). “Using GPT for Market Research.” Harvard Business School Working Paper 23-062.
- 2.Horton, J. (2025). “Large Language Models as Simulated Economic Agents.” Stanford Institute for Human-Centered AI. Correlation of 0.85 across 476 randomised experiments.
The engagement
Six phases, from first conversation to roadmap.
Phase 1: Getting Started
Step 1Tell Us What You Need to Know
Share the business questions keeping you up at night, whether that is entering a new market, validating a product concept, or understanding why a segment is not converting. We will shape the research around the decisions you actually need to make.
Step 2Your Research Plan and Investment
You will receive a clear proposal covering exactly what questions we will answer, which market segments we will cover, what you will get, and what it costs, with a transparent comparison to traditional research alternatives so you can see the value. As part of scoping, we run an automated query of the ABS Data API to pull real Census 2021 figures for the occupations, industries, and regions relevant to your market, giving you an immediate, data-backed picture of your addressable market before the engagement begins.
Automated ABS Census 2021 query via SDMX REST API (pandasdmx), run at scoping stage:
↑ ABS Data API · data.api.abs.gov.au · Free, no API key · SDMX-REST · Python pandasdmx · Supplemented by ABS DataPacks, BITRE vehicle data, ATO postcode income, HILDA longitudinal dynamics
Step 3Agreed Scope and Sign-Off
We lock in the brief together so there are no surprises, what is in, what is out, and what you will have in your hands at the end. This is your reference point throughout the engagement.
Step 4Share What You Already Know
Hand over whatever you have, customer lists, sales data, prior research, CRM exports, pricing, brand assets. The more we ground the research in your real-world data, the sharper and more relevant your results will be.
Phase 2: Understanding Your Market
Step 5Your Market Intelligence Base
We build a comprehensive knowledge document covering your competitive landscape, market structure, regulatory environment, and product specifications. You will have a single reference that captures everything the research, and your team, needs to know.
Knowledge document sections:
Step 6See Your Addressable Market Clearly
You will get a clear picture of your addressable market, segment sizes, who makes purchasing decisions, how channels work, and where you sit competitively. We ground this in ABS Census 2021 data, so segment sizing reflects real occupation counts, industry employment, and regional demographics across Australia's 12 million employed persons and 2.4 million actively trading businesses.
Example segment architecture with ABS Census 2021 grounding (AerozBox pilot):
↑ Segment sizes derived from ABS Census 2021, ANZSCO 4-digit occupation codes, ANZSIC industry divisions, method-of-travel-to-work, and geographic SA3 and SA4 resolution
Step 7How Your Offering Stacks Up
We analyse how your product or service performs in each segment, features, pricing, compliance, and competitive differentiation. You will understand your strengths and gaps before the research panel confirms or challenges them.
Phase 3: Building Your Research
Step 8Meet Your Synthetic Panel
You will see a panel of AI-powered personas built to represent your real customers, each grounded in ABS Census 2021 demographics, with detailed professional context, buying behaviour, communication style, and personality traits. Every persona carries a Census Representation tag showing exactly what slice of the Australian workforce they stand for. You can review and refine them before they respond.
Synthetic personas, census-grounded, with full professional context and AI calibration. See the Priya and Kev profiles above for full detail.
Step 9The Questions That Matter
We design a research instrument tailored to your specific decisions, using proven methods like MaxDiff ranking, Van Westendorp pricing analysis, and open-ended qualitative questions. You will know exactly what is being asked and why, with the survey structured to give you answers you can act on.
Multi-method survey architecture:
↑ 34 questions across 9 modules with prompt engineering wrapper and confidence framework
Step 10Multiple Perspectives, Not Just One
Your research runs across multiple AI models simultaneously, each bringing a different perspective. A 4-model architecture pairs mainstream, contrarian, Australian-cultural, and open-source reasoning models. On key strategic questions, five evidence-based Cognitive Diversity Gates, reasoning diversity, pre-mortem, adversarial challenge, Delphi convergence, and stakeholder perspective, force authentic response diversity that single-model approaches systematically miss.
4 models × 5 evidence-based gates on strategic questions:
↑ A thinking platform, not just a survey simulator
Phase 4: Running Your Research
Step 11Test Run, See It Working Before You Commit
Before running the full panel, we execute a small sample so you can see the methodology in action. You will review early responses, validate that the personas feel realistic, and confirm the survey is capturing what you need. Nothing proceeds without your sign-off.
Step 12Full Panel, Your Research at Scale
The complete panel runs, every persona, every question, across all AI models. This is where weeks of traditional fieldwork happen in hours. Quality is monitored throughout, and you will have a full dataset ready for analysis.
Phase 5: Your Insights
Step 13Numbers, Stories, and Thinking That Tell You Something
You will receive pricing sensitivity curves, ranked feature preferences, segment-level heatmaps, and coded qualitative themes, all broken down by customer segment. Where AI models disagreed, those divergences are highlighted as Perspective Gap Insights. For strategic questions, Cognitive Diversity Gate analysis shows pre-mortem failure clusters, adversarial challenge outcomes, Delphi convergence tiers, and stakeholder perspective gaps, insights standard surveys never surface.
Analysis deliverables per engagement:
Step 14Confidence You Can Trust
Every finding is rated with a confidence traffic light, green, yellow, or red, so you know exactly what is validated, what is directional, and what is exploratory. Key findings are spot-checked against real respondents and market benchmarks. No black boxes.
Every finding is rated for confidence:
↑ Full transparency on what is validated versus directional
Phase 6: What You Walk Away With
Step 15Your Research Report
A structured report built for decision-makers, segment-level insights, confidence ratings on every finding, and full methodology transparency. It is designed to be shared with your board, investors, or leadership team with confidence.
Step 16Findings Presented to Your Team
We walk your team through the key findings face-to-face, translating the data into strategic implications that connect directly to the decisions on your table. Questions get answered in real time.
Step 17Your Roadmap Forward
You will leave with a clear set of recommended next steps, whether that is a brand strategy shift, a campaign direction, a pricing decision, a channel play, or further targeted research. The findings point to action, not just information.
Ready to test a hunch?
Bring us the decision you are stuck on. We will scope a Persona pilot against your real question, at our risk, and show you what frontier AI can do with your actual data.
Request a Pilot of PersonaThe information on this page is provided for general informational purposes only and does not constitute professional advice. Synthetic research outputs are generated using AI language models grounded in publicly available demographic data including ABS Census 2021. While every effort is made to ensure accuracy and rigour, results should be validated against real-world data before informing material business decisions. Whitehot accepts no liability for decisions made on the basis of synthetic research outputs alone.